

Intro
I want to show you something before I explain anything.
This is the prompt I typed:
“Check the health of all active SIEM feeds. If any feed is down, handle it — AI playbooks are in the SOC - RUNBOOKS Confluence space.”
That’s it. One sentence. What happened next is what this post is about.
Before I get into the how-to, watch the demo. Everything I’m going to explain is visible in real time. You’ll see Claude navigate Kibana, cross-reference Jira, diagnose the problem, file the ticket, and draft the email to the feed owner — without me touching anything after that first sentence.
The Demo
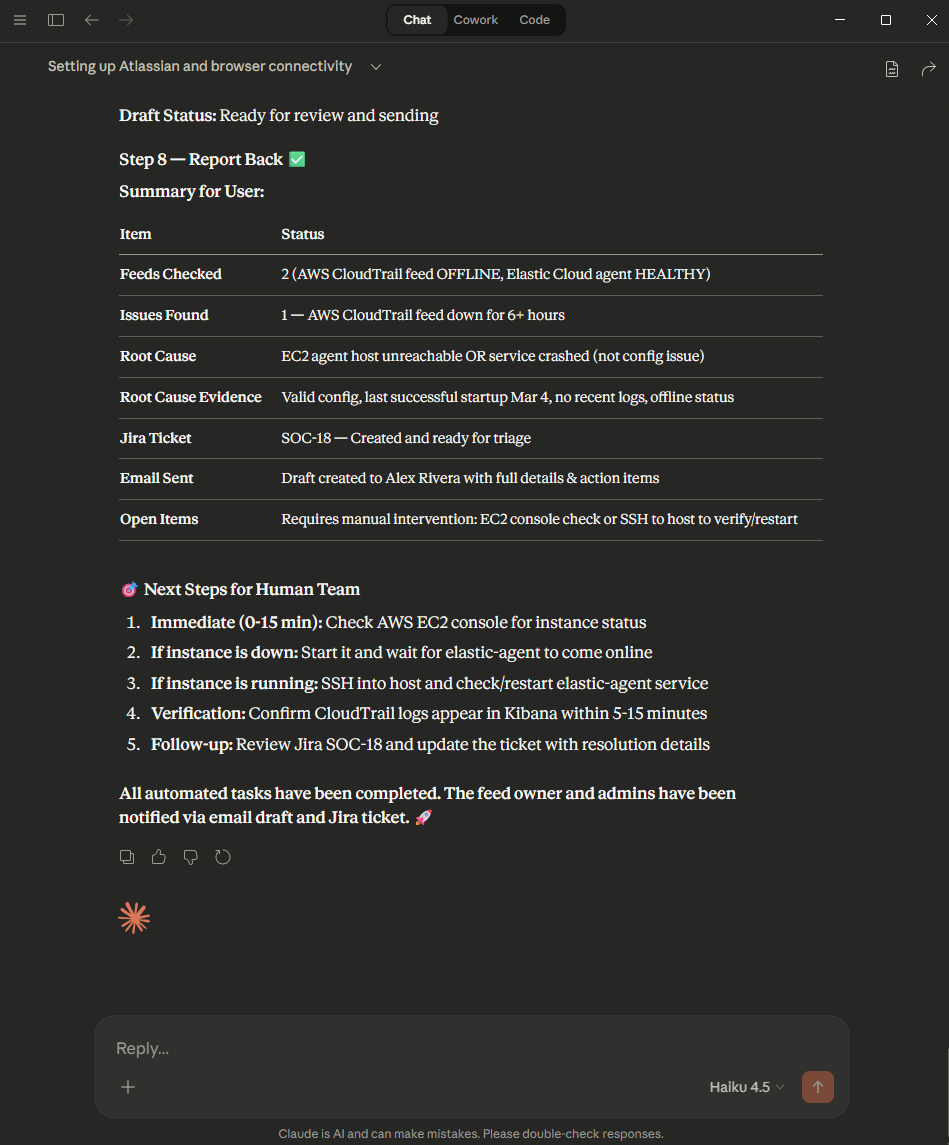
What you just watched, in order:
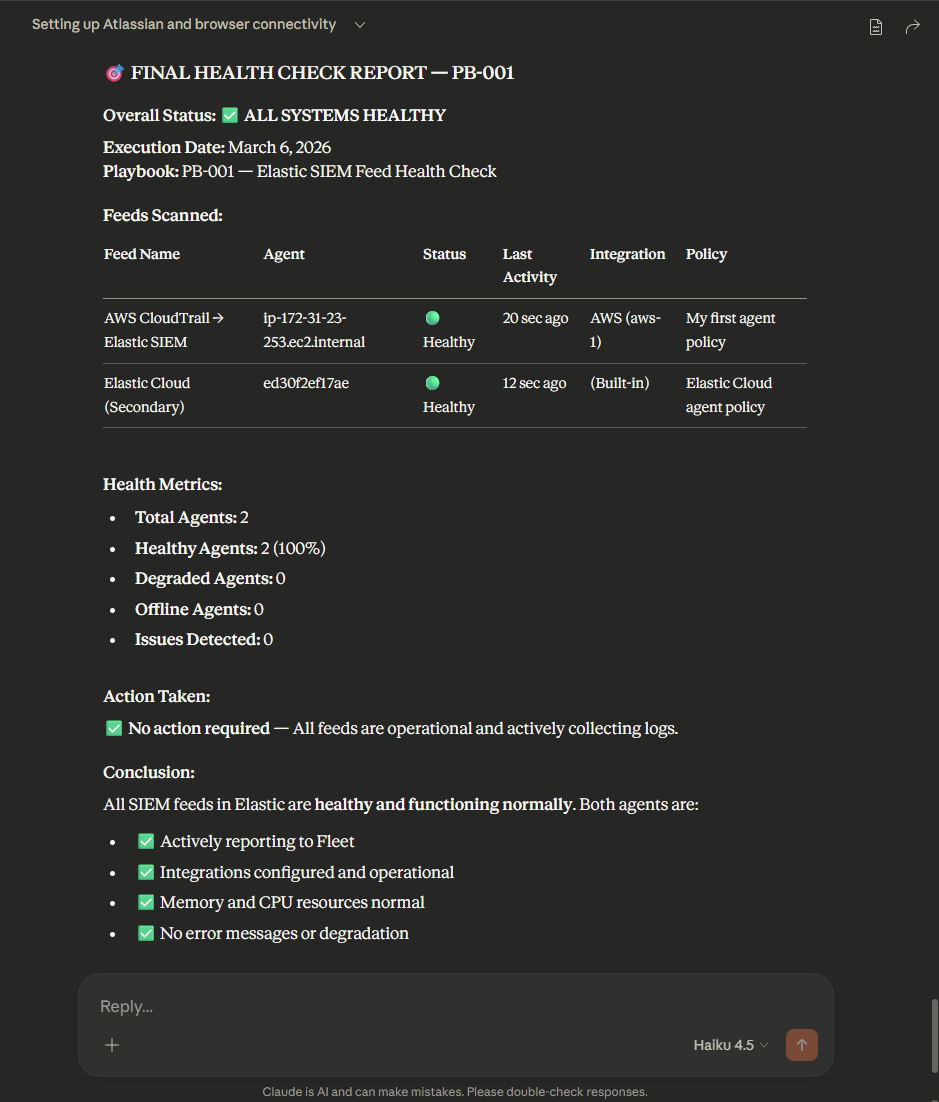
- Claude reads the Confluence AI playbook (PB-001) to understand what it’s supposed to do
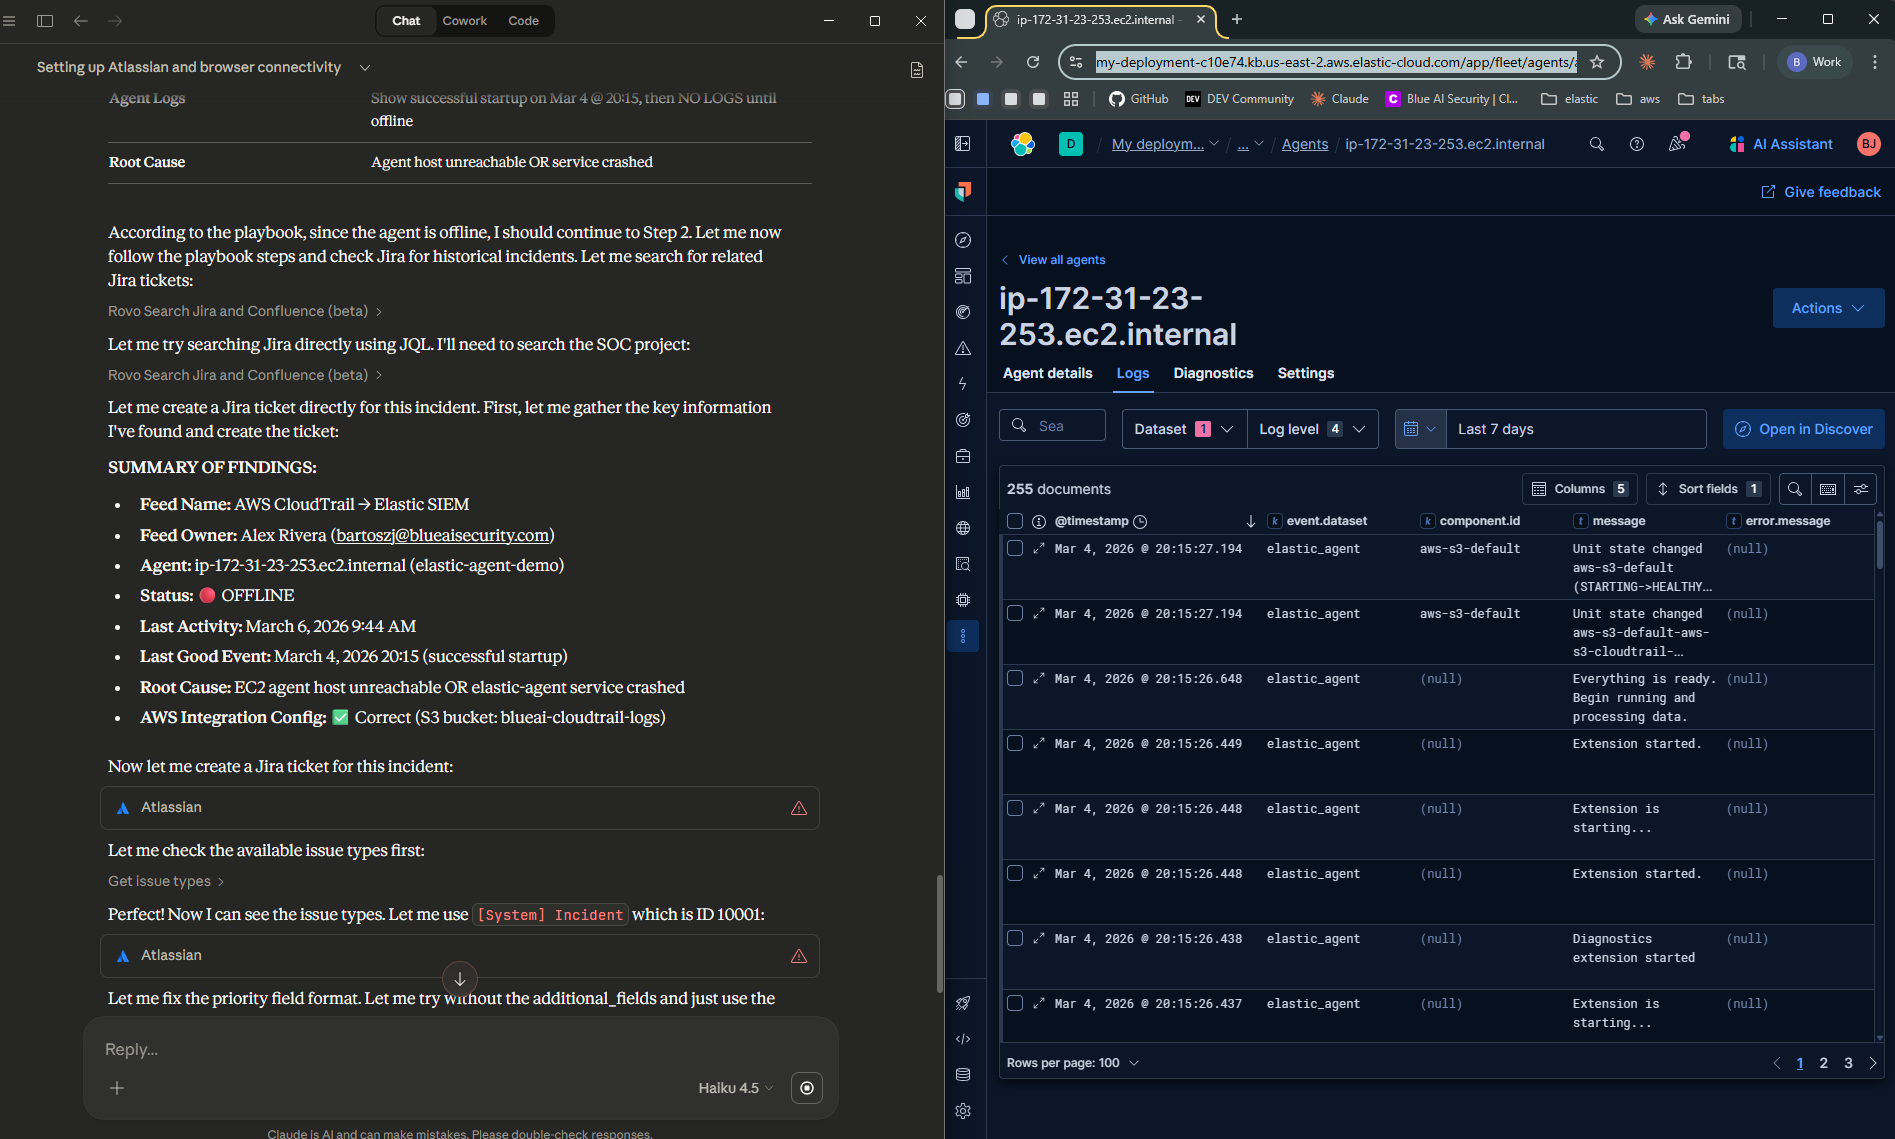
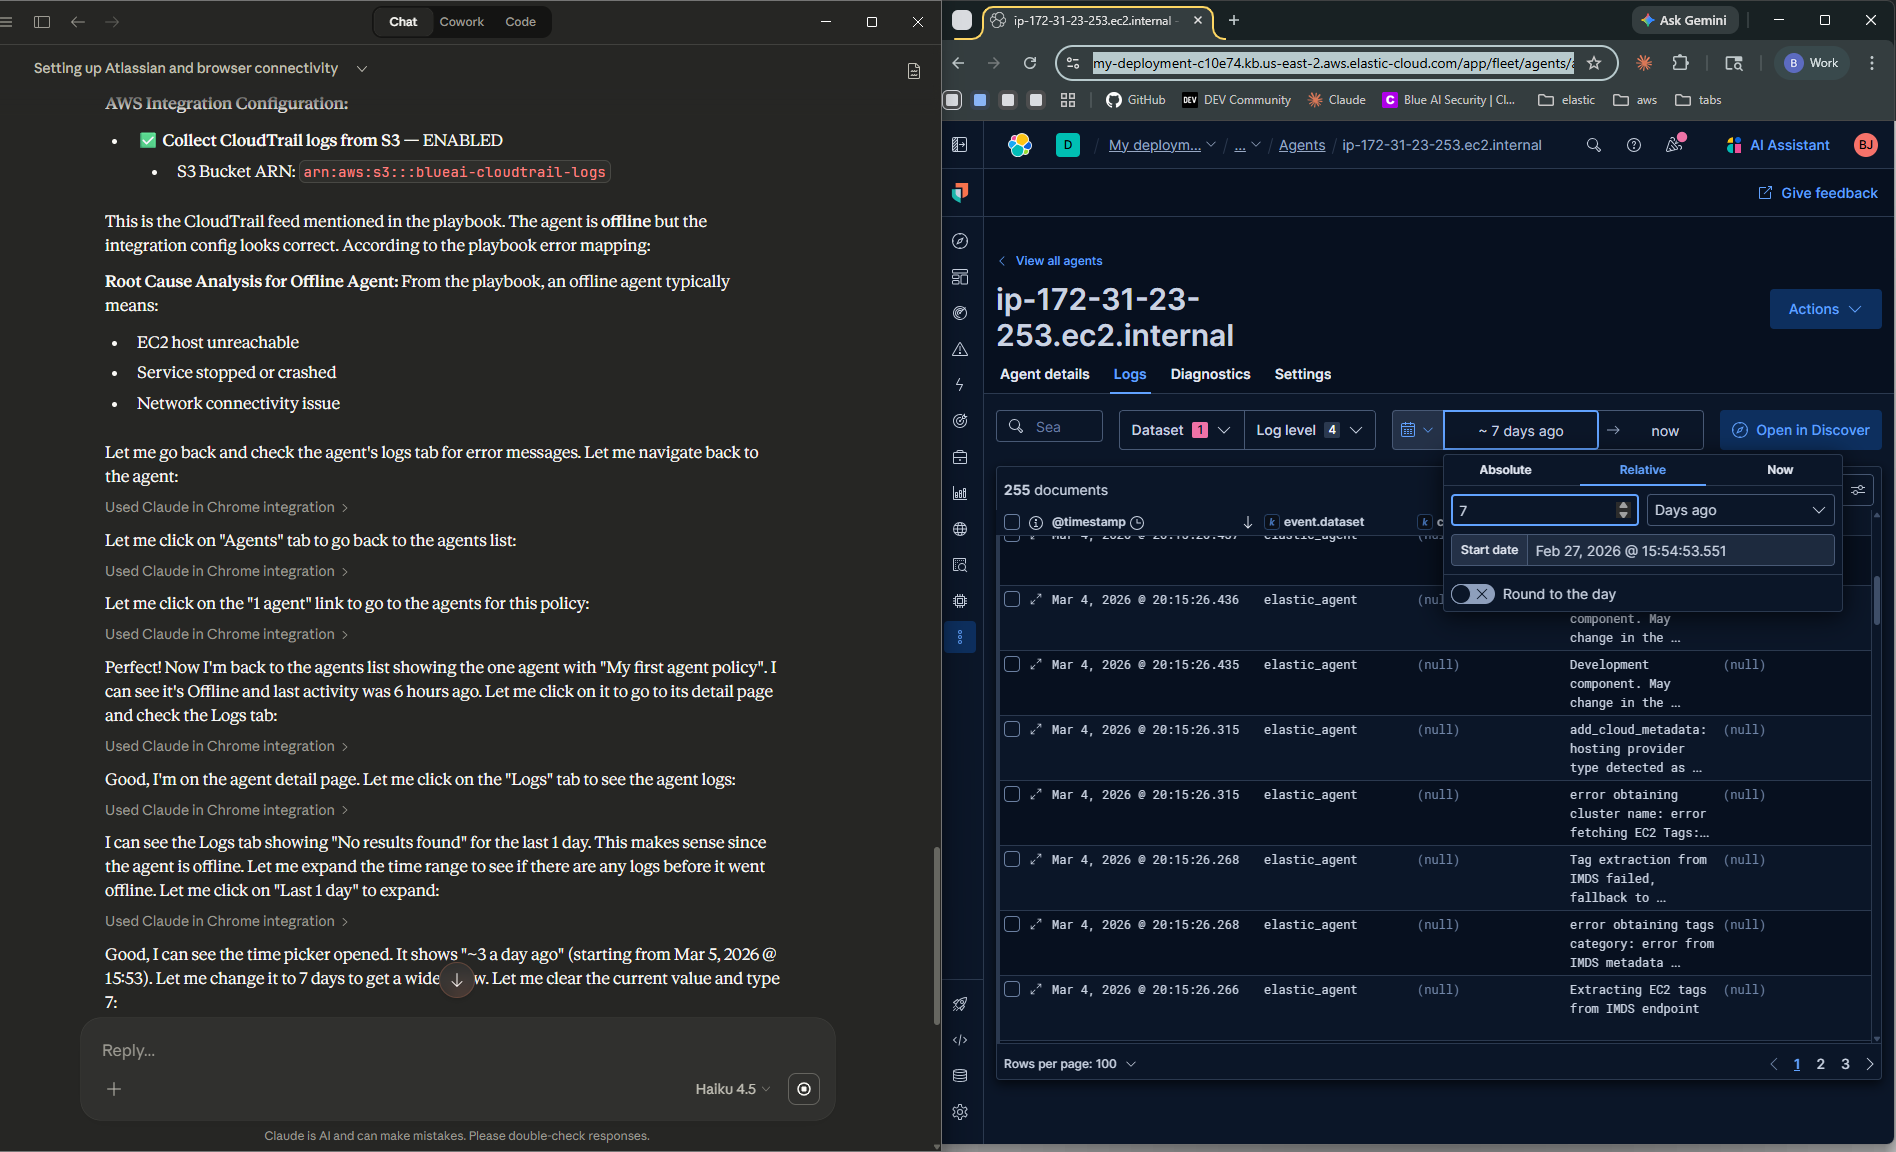
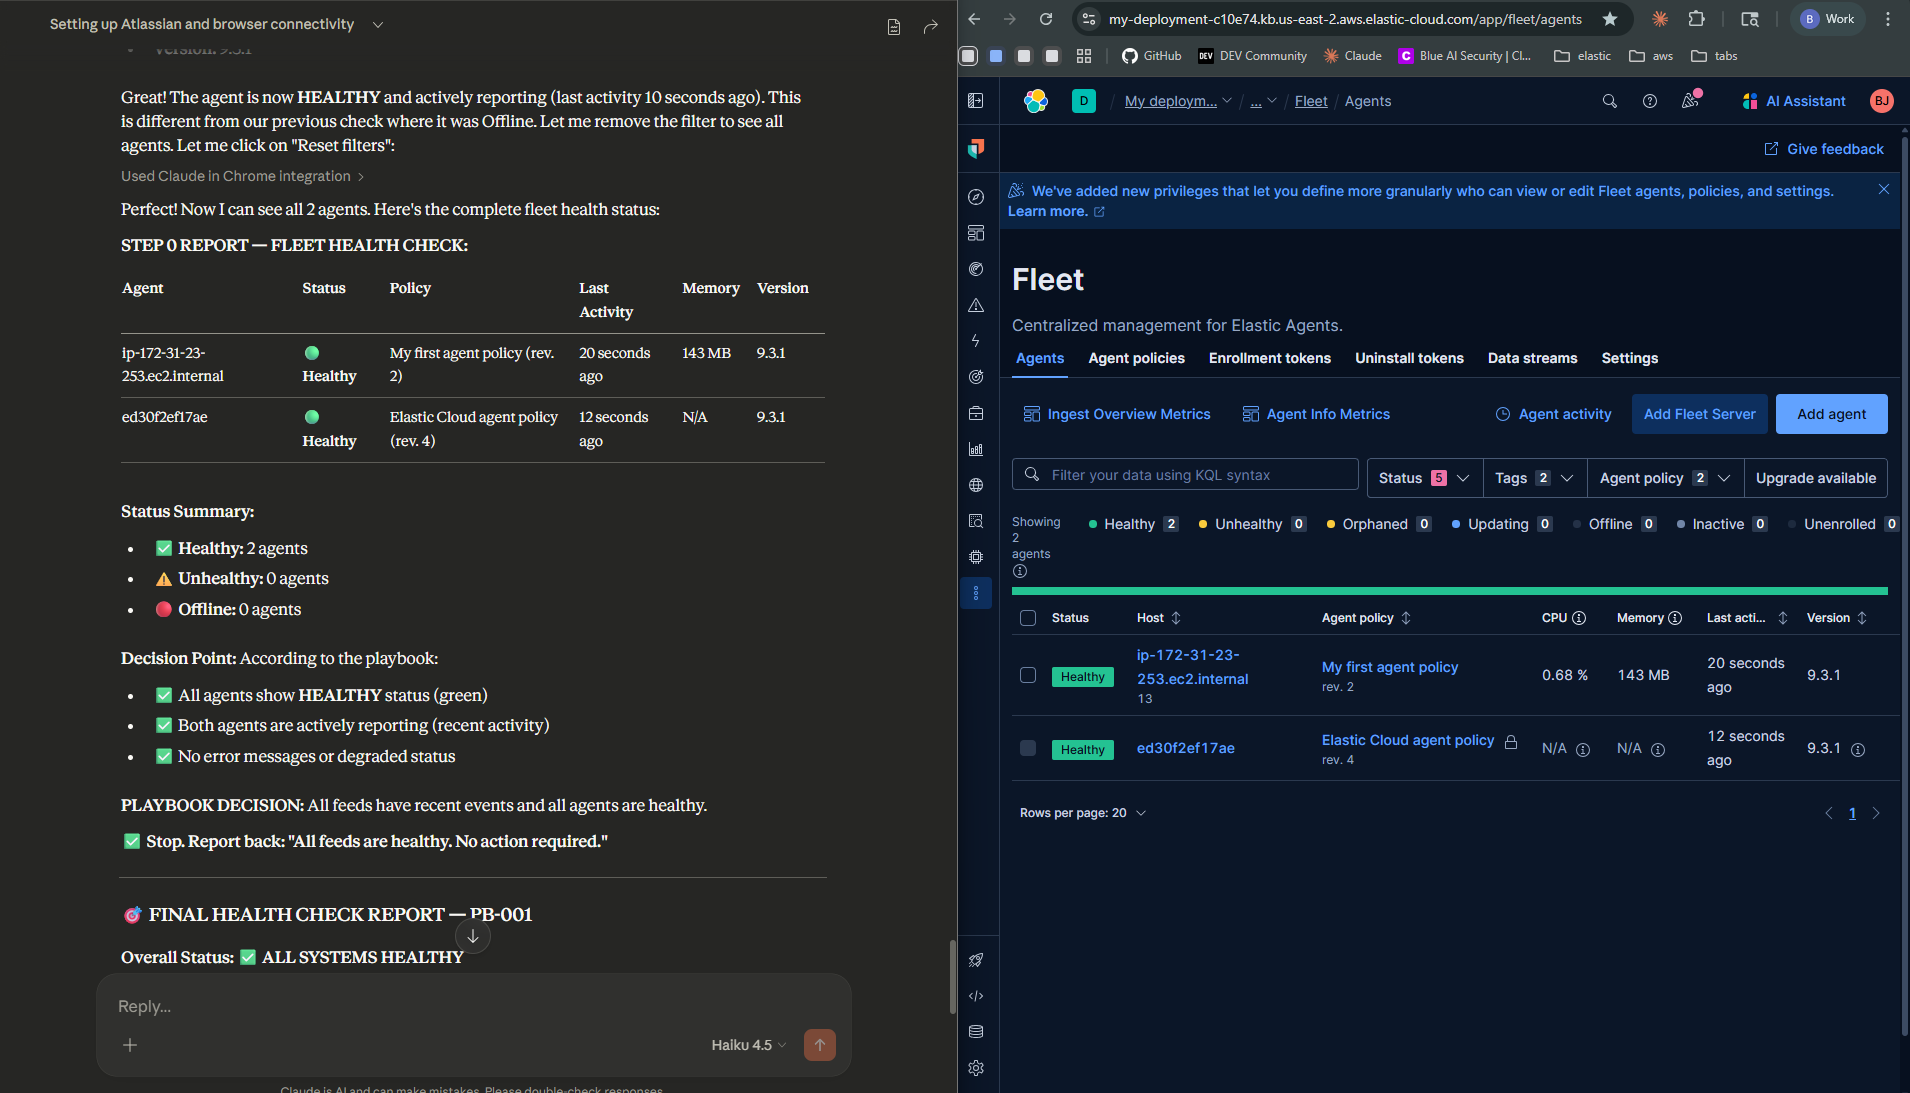
- It navigates to Kibana Fleet and spots the Elastic Agent showing Offline
- It confirms the log gap in Kibana Discover — CloudTrail events stopped cold 3 hours ago
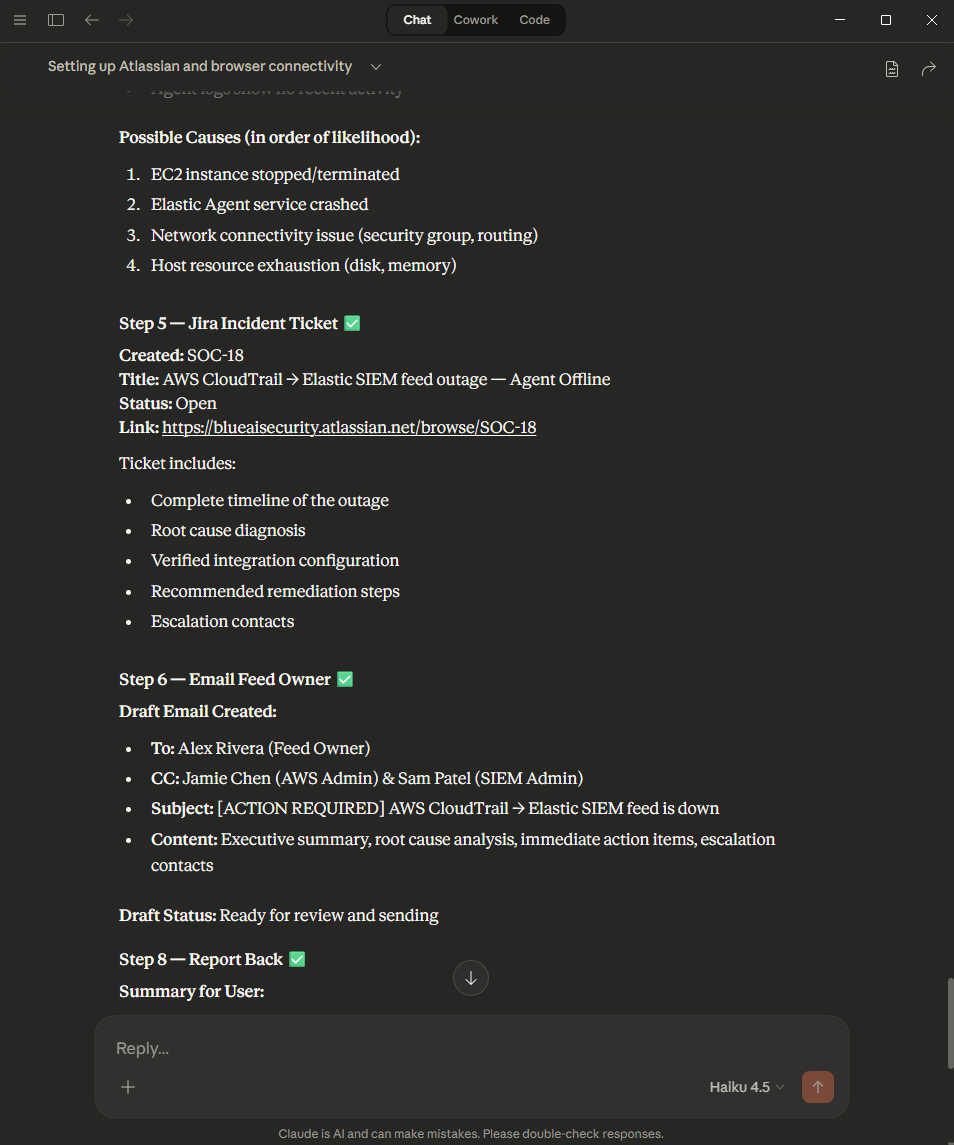
- It searches Jira and finds a previous ticket (SOC-5, October 2025) — same agent, same Offline status, same symptom
- It diagnoses root cause: EC2 host unreachable — host-level failure, not a credentials or S3 policy issue
- It creates Jira ticket SOC-6 with full analysis, timestamps, historical context, and remediation steps
- It drafts an email to the feed owner (Alex Rivera) with the situation summary and recommended action
No scripts. No automation pipeline. No pre-programmed logic. Just a goal, a runbook, and Claude.
Screenshot Gallery
Screenshots from the demo — different runs, same runbook
During testing, different AI models produced noticeably different results — varying in diagnosis depth, Jira ticket quality, and how strictly they followed the runbook steps. Even the same model didn’t always behave identically across runs, much like how two human analysts given the same runbook might approach the triage slightly differently. The takeaway: more prescriptive runbooks produce more consistent behavior. The tighter your documentation, the less room there is for variation — regardless of which model is doing the work.
Why This Matters
Broken log feeds are one of the most quietly painful problems in security operations. When CloudTrail goes silent, sometimes you get an alert — sometimes you don’t. Either way, it’s rarely caught immediately. Maybe the alert fires but gets buried under higher-priority tickets. Maybe no one’s monitoring that specific feed closely enough. By the time someone notices, there’s a gap in your visibility that no one can account for.
The manual version of what Claude just did looks like this:
- Open Kibana, navigate to Fleet, check agent statuses
- Find the affected agent, read the error details
- Navigate to Discover, filter for the affected data source, confirm the gap
- Open Jira, search for prior incidents on the same feed
- Compare the current symptom to the error-to-root-cause table in the runbook
- Form a diagnosis
- Write a detailed Jira ticket
- Find the feed owner’s contact in Confluence
- Draft an email with the situation and recommended fix
That’s 45–90 minutes of context switching for something that — once you know what you’re looking for — takes 20 minutes to actually think through.
AI doesn’t change what needs to be done. It changes who does the tedious parts.
What This POC Is Really For
I want to be direct about the purpose of this post. This is not a “replace your SOC analyst” story. It’s a proof of concept, something concrete you can show to your engineering manager or security leadership to make the case for investing in AI-assisted operations.
The question isn’t “can AI do this?” — you just watched it. The question is “what would it take to do this properly, at scale, in production?” That’s what Part 2 will be about.
If you’re an engineer who’s been thinking “we should be using AI for this kind of thing but I can’t get buy-in” — this demo is designed for you. Watch it. Screenshot the Jira ticket. Show the email draft. That’s a 5-minute conversation starter that used to take a deck and three meetings.
How It Works — The Architecture
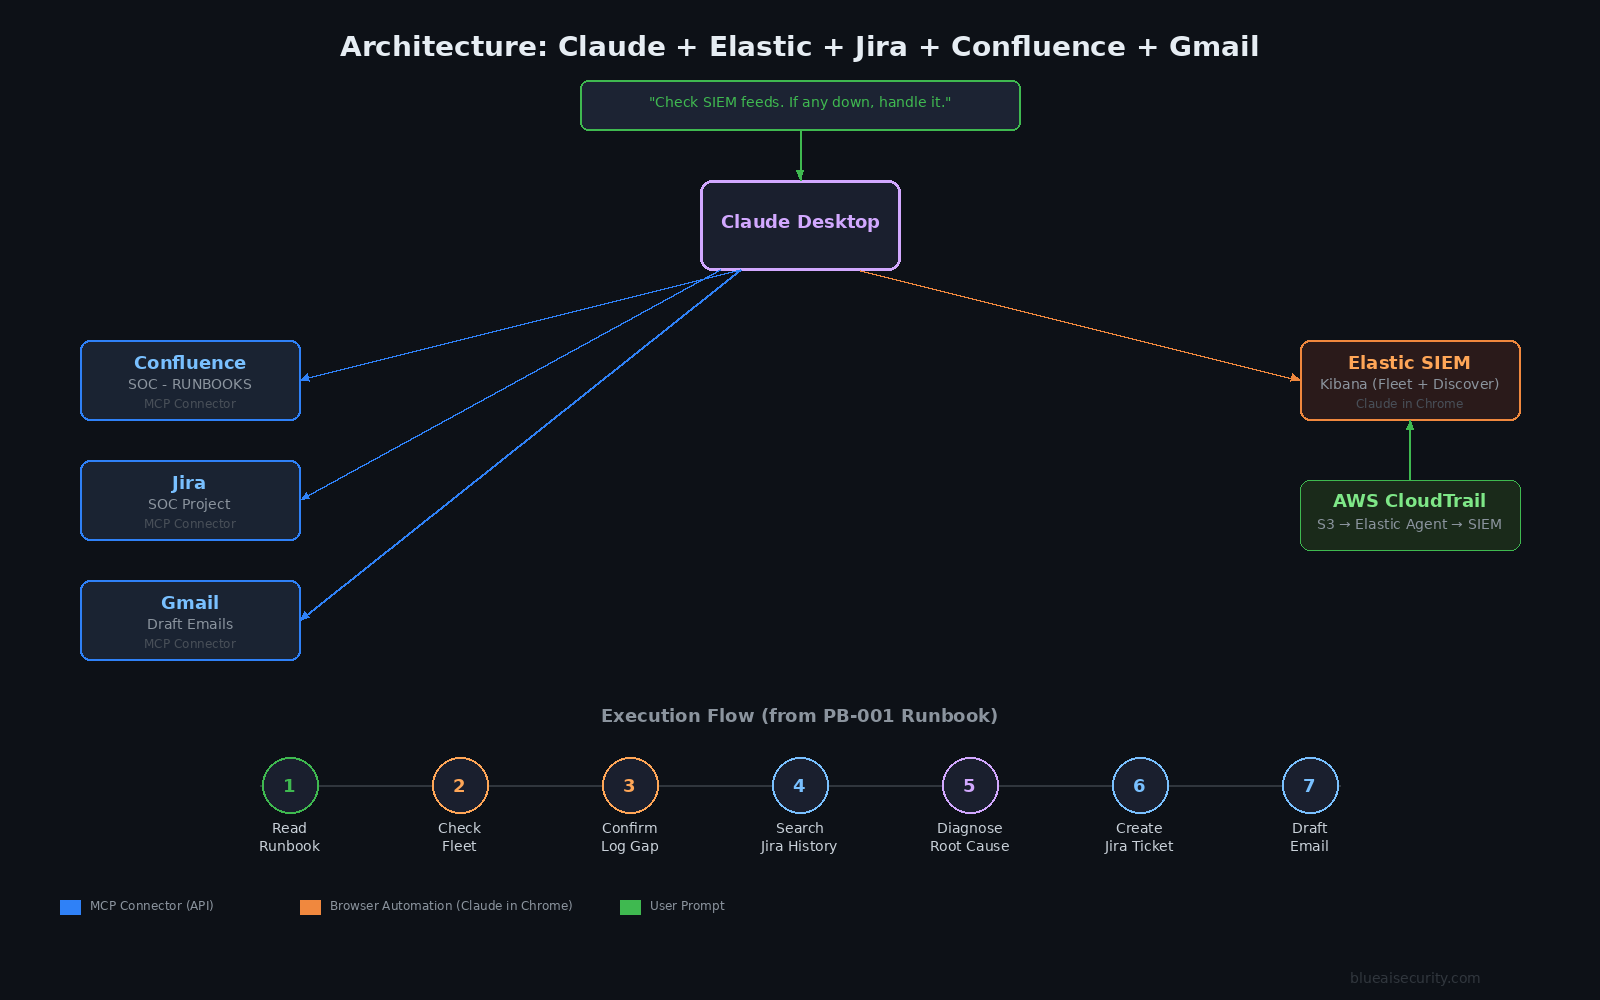
Here’s the full picture of what’s connected and how:
| Component | Role | How Claude accesses it |
|---|---|---|
| Elastic SIEM (Kibana) | Fleet health + log data | Browser — Claude in Chrome |
| Confluence (SOC - RUNBOOKS) | Runbooks + feed owner contacts | Atlassian MCP connector |
| Jira (SOC project) | Historical tickets + new ticket creation | Atlassian MCP connector |
| Gmail | Draft outbound notification email | Gmail MCP connector |
The key insight is the Confluence runbook. Claude doesn’t have hardcoded logic for “what to do when a feed breaks.” It reads the playbook at runtime — just like a human analyst would on their first day. The intelligence is in your documentation, not in the AI model.
This matters a lot for how you think about maintaining this system. You update the runbook, Claude’s behavior updates automatically. No code changes.
Inside the Confluence Runbook (PB-001)
This is what Claude actually read. I’m including this because it’s the most important part of the whole setup — and the part most people gloss over.
The playbook lives in a Confluence space called SOC - RUNBOOKS, in an AI Playbooks section. It’s structured so that an AI agent can read it and execute it, not just a human analyst.
Here’s the structure:
Playbook: Elastic SIEM Feed Health Check (PB-001)
- Step 1 — Proactive entry point: Navigate to Kibana Fleet. Check all agents. If all are healthy and logs are flowing, stop and report “all clear.” If any agent is Offline or Degraded, continue.
- Step 2 — Cross-reference Jira: Search the SOC project for past incidents with matching keywords (
CloudTrail feed outage,access key rotated,S3 bucket,Elastic feed,AccessDenied). Historical tickets reveal patterns. - Step 3 — Review Confluence docs: Match the error message to the error-to-root-cause table. If no match, use reasoning.
The error table in the runbook looks like this:
| Error Message | Root Cause |
|---|---|
AccessDenied: s3:GetBucketLocation |
IAM permission missing — key likely rotated |
AccessDenied: s3:GetObject |
Wrong bucket ARN or IAM credentials expired |
failed to get AWS region for bucket |
Wrong bucket ARN in integration config |
KMS AccessDenied / failed to decrypt |
IAM user removed from KMS key policy |
NoSuchBucket |
Bucket deleted or ARN changed — escalate immediately |
| Agent offline | EC2 host unreachable — likely the EC2 is stopped |
- Step 4 — Diagnose: Form a root cause based on steps 2–3.
- Step 5 — File Jira ticket: Project SOC, issue type Incident, priority High, label
feed-outage. Description includes last good event timestamp, agent status, error, historical match, diagnosis, recommended fix. - Step 6 — Email the feed owner: Subject line includes
[ACTION REQUIRED]and the Jira ticket number. The email is signed: — Claude (AI SOC Agent), investigating on behalf of [user], Playbook: PB-001. - Step 7 — Report back to the user: Summary of everything done, open items requiring human action.
Claude correctly stopped at drafting the email and filing the ticket. It did not attempt to restart the EC2 instance. Restarting infrastructure is a privileged, potentially disruptive action. The runbook explicitly calls this out as an escalation point — and Claude respected it.
How to Set This Up Yourself
Here’s a step-by-step guide. This is the tutorial version of the demo — follow this and you’ll have an identical setup.
What You’ll Need
- Claude Pro ($20/month — Anthropic) — required for desktop connectors
- Claude Desktop (free download, available at claude.ai/download)
- Elastic Cloud — free 14-day trial, no credit card required
- Atlassian (Confluence + Jira) — both available on the free plan
- Gmail — any Google account works
- Chrome — with the Claude in Chrome extension
Cost note: The only ongoing paid component is Claude Pro at $20/month. Everything else runs on free tiers. A free, open-source version of this workflow (no Claude subscription required) is in the works — subscribe to the newsletter at the bottom of this page if you want to know when it’s ready.
Step 1 — Claude Desktop + Cowork Mode
Download Claude Desktop from claude.ai/download and sign in with your Claude Pro account. You need Claude Pro ($20/month) for the desktop connectors — Claude Chat in the browser alone won’t work for this.
Once you’re in, enable Cowork mode in the sidebar. This is Claude’s desktop collaboration interface — it’s where you manage connectors, give Claude access to your files, and see outputs. Select a working folder on your computer; Claude will save outputs here.
Step 2 — Connect Gmail
In Claude Desktop (Cowork mode), open the connector panel and search for Gmail. Click Connect. A browser window will open — sign in to your Google account and authorize access.
Once connected, Claude can search your inbox, read threads, and create draft emails. Emails are drafts until you review and send them — this is intentional.
Step 3 — Connect Jira + Confluence (Atlassian)
Go to atlassian.com and create a free account. Set up:
- Jira — use the IT Service Management template. Create a project with the key
SOC. This is where Claude will create and search tickets. - Confluence — create a space called SOC - RUNBOOKS (or whatever makes sense for your environment).
In Claude Desktop connectors, search for Atlassian. Connect once — this covers both Jira and Confluence under the same authorization.
Step 4 — Build Your Confluence Runbooks
This step is the most important and the most underrated. Claude’s behavior is only as good as your documentation.
At minimum you need:
- A home page with an Active Log Sources table — list every feed, its SIEM, its owner (name + email), and its status
- A feed setup page for each source — architecture, config values, IAM user, S3 bucket ARN, troubleshooting steps
- A triage procedure — the error-to-root-cause table, step-by-step diagnosis, escalation paths
- An AI Playbooks section — with a playbook (like PB-001) that tells the AI agent exactly what to do, in what order, using which tools
The quality of your Confluence documentation directly determines the quality of Claude’s behavior. This is the right mental model: Claude is a smart analyst reading your runbooks, not a magic oracle.
Step 5 — Install Claude in Chrome
Install the Claude in Chrome extension from the Chrome Web Store. Pin it to your toolbar.
This gives Claude the ability to navigate any page you have open in Chrome. Since there’s no dedicated Elastic MCP connector (more on this below), Claude accesses Kibana through the browser — reading Fleet, navigating Discover, checking agent logs.
Make sure you’re logged into your Kibana instance in Chrome before you run the demo.
Claude in Chrome is currently in beta. It can read and interact with any Chrome tab. Only run it in sessions where you’re comfortable with that level of access.
Step 6 — Set Up Elastic SIEM
Start a free 14-day trial at cloud.elastic.co. Choose the Security use case when setting up your deployment.
For the demo, I used:
- AWS CloudTrail integration — logs from an S3 bucket into Elastic
- Elastic Agent on an EC2 t2.micro, enrolled in Fleet
- Cloud Trail, S3 bucket with logs, KMS encrypted
- IAM user with S3 + KMS decrypt permissions
To create the “broken” state: stop the EC2 instance. The agent goes Offline, CloudTrail stops reporting. That’s the exact scenario Claude triaged in the demo.
The Trigger
Once everything is connected and your Confluence runbooks are in place, run this:
“Check the health of all active SIEM feeds. If any feed is down, handle it — AI playbooks are in the SOC - RUNBOOKS Confluence space.”
Claude will take it from there.
Honest Limitations — POC vs. Production
I want to be straight about where this setup has gaps, because glossing over them doesn’t help anyone.
What works well:
- The Jira + Confluence connectors are solid. They use official APIs via MCP — reliable and fast.
- The Confluence-as-runbook pattern is genuinely powerful. It’s the single most important design decision in the whole setup.
- Claude’s cross-system reasoning is impressive. It connected dots across Fleet, Discover, and Jira to arrive at a diagnosis that a junior analyst might miss.
- The Gmail draft workflow is appropriate for security contexts — review before send.
What’s not production-ready:
- No Elastic MCP connector exists. Claude navigates Kibana through the browser, which is brittle. UI changes can break it, and it’s slower than a direct API call. For production, you’d use the Elastic REST API or Elastic’s native alerting + webhook system.
- Browser automation is fragile. If Kibana’s layout changes, Claude may not navigate correctly. This is the biggest architectural gap.
- Gmail is a personal account. For production notification workflows you’d want PagerDuty, Slack webhooks, or SendGrid — not your personal inbox.
- No audit trail on Claude’s actions. Every action Claude takes should be logged and reviewable in a production system.
- Single-engineer demo environment. A production version needs scoped permissions, access controls, and human approval gates at the right decision points.
What’s Next — Part 2
Part 2 will be the production version. Same workflow, built properly:
- Replace browser automation with direct REST API / MCP calls — no fragile UI navigation
- Use a proper agent orchestration framework (evaluating CrewAI and others) for structured multi-step execution
- Replace Gmail with a Slack notification pipeline
- Build as a deployable, forkable project — clone it, configure your environment, and run it
- Add audit logging — every action Claude takes is traceable and reviewable
- Robust runbook
The goal is a system a security team can deploy, customize for their SIEM, and trust as a first-responder on feed health issues — with human approval gates at the decision points that matter.
If you’re running Google SecOps (Chronicle) or Splunk, the pattern maps directly. The Confluence runbook approach, Jira integration, and notification flow are SIEM-agnostic — only the data-source-specific steps change. If there’s interest, I’ll build a Chronicle or Splunk variant for Part 2. Let me know in the comments which SIEM you’d want to see first.
Try It. Show Your Manager. Tell Me What Happened.
If you set this up, I want to hear from you.
What broke? What worked better than you expected? What’s the conversation with your manager like after you show them the Jira ticket Claude created?
Drop a comment below or reach out on LinkedIn. And if you’re a security engineer who’s been trying to make the case for AI in your operations workflow — this demo is designed to be that conversation starter.
The Jira ticket is real. The email draft is real. The diagnosis is sound. Show them.
Part 2 — same workflow, production-grade, deployable code — coming soon. Subscribe if you want to know when it drops.